


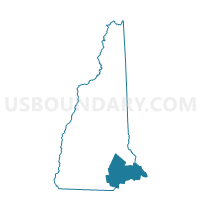
Census Tract 1041.01, Rockingham County, New Hampshire
About
Outline

Summary
| Unique Area Identifier | 472205 |
| Name | Census Tract 1041.01 |
| County | Rockingham County |
| State | New Hampshire |
| Area (square miles) | 6.55 |
| Land Area (square miles) | 6.48 |
| Water Area (square miles) | 0.07 |
| % of Land Area | 98.94 |
| % of Water Area | 1.06 |
| Latitude of the Internal Point | 42.87328580 |
| Longtitude of the Internal Point | -71.14888650 |
| Total Population | 4,781 |
| Total Housing Units | 2,112 |
| Total Households | 1,978 |
| Median Age | 46 |
Maps

Graphs
Select a template below for downloading or customizing gragh for Census Tract 1041.01, Rockingham County, New Hampshire


Neighbors
Neighoring Census Tract (by Name) Neighboring Census Tract on the Map
- Census Tract 1011, Rockingham County, NH
- Census Tract 1031, Rockingham County, NH
- Census Tract 1041.02, Rockingham County, NH
- Census Tract 1051, Rockingham County, NH
- Census Tract 520, Rockingham County, NH
- Census Tract 530, Rockingham County, NH
Top 10 Neighboring County Subdivision (by Population) Neighboring County Subdivision on the Map
- Hampstead town, Rockingham County, NH (8,523)
- Plaistow town, Rockingham County, NH (7,609)
- Atkinson town, Rockingham County, NH (6,751)
- Kingston town, Rockingham County, NH (6,025)
- Sandown town, Rockingham County, NH (5,986)
- Danville town, Rockingham County, NH (4,387)
Top 10 Neighboring Unified School District (by Population) Neighboring Unified School District on the Map
- Timberlane Regional School District, NH (24,733)
- Sanborn Regional School District, NH (10,628)
- Hampstead School District, NH (8,523)
Top 10 Neighboring State Legislative District Lower Chamber (by Population) Neighboring State Legislative District Lower Chamber on the Map
- State House District 8, Rockingham County, NH (22,157)
- State House District 7, Rockingham County, NH (15,141)
- State House District 6, Rockingham County, NH (6,751)
Top 10 Neighboring State Legislative District Upper Chamber (by Population) Neighboring State Legislative District Upper Chamber on the Map
- State Senate District 17, NH (58,086)
- State Senate District 23, NH (56,793)
- State Senate District 22, NH (56,033)
- State Senate District 19, NH (55,224)
Top 10 Neighboring 111th Congressional District (by Population) Neighboring 111th Congressional District on the Map
Top 10 Neighboring 5-Digit ZIP Code Tabulation Area (by Population) Neighboring 5-Digit ZIP Code Tabulation Area on the Map
- 03865, NH (7,609)
- 03811, NH (6,753)
- 03841, NH (6,334)
- 03848, NH (6,020)
- 03873, NH (5,711)
- 03819, NH (4,377)
- 03826, NH (2,470)
Data
Demographic, Population, Households, and Housing Units
** Data sources from census 2010 **
Show Data on Map
Download Full List as CSV
Download Quick Sheet as CSV
| Subject | This Area | Rockingham County | New Hampshire | National |
|---|---|---|---|---|
| POPULATION | ||||
| Total Population Map | 4,781 | 295,223 | 1,316,470 | 308,745,538 |
| POPULATION, HISPANIC OR LATINO ORIGIN | ||||
| Not Hispanic or Latino Map | 4,730 | 289,081 | 1,279,766 | 258,267,944 |
| Hispanic or Latino Map | 51 | 6,142 | 36,704 | 50,477,594 |
| POPULATION, RACE | ||||
| White alone Map | 4,665 | 281,966 | 1,236,050 | 223,553,265 |
| Black or African American alone Map | 12 | 1,996 | 15,035 | 38,929,319 |
| American Indian and Alaska Native alone Map | 4 | 486 | 3,150 | 2,932,248 |
| Asian alone Map | 38 | 4,943 | 28,407 | 14,674,252 |
| Native Hawaiian and Other Pacific Islander alone Map | 0 | 100 | 384 | 540,013 |
| Some Other Race alone Map | 11 | 1,678 | 12,062 | 19,107,368 |
| Two or More Races Map | 51 | 4,054 | 21,382 | 9,009,073 |
| POPULATION, SEX | ||||
| Male Map | 2,350 | 145,886 | 649,394 | 151,781,326 |
| Female Map | 2,431 | 149,337 | 667,076 | 156,964,212 |
| POPULATION, AGE (18 YEARS) | ||||
| 18 years and over Map | 3,730 | 227,785 | 1,029,236 | 234,564,071 |
| Under 18 years | 1,051 | 67,438 | 287,234 | 74,181,467 |
| POPULATION, AGE | ||||
| Under 5 years | 198 | 14,983 | 69,806 | 20,201,362 |
| 5 to 9 years | 271 | 18,333 | 77,756 | 20,348,657 |
| 10 to 14 years | 332 | 20,699 | 84,620 | 20,677,194 |
| 15 to 17 years | 250 | 13,423 | 55,052 | 12,954,254 |
| 18 and 19 years | 103 | 6,387 | 38,568 | 9,086,089 |
| 20 years | 47 | 2,724 | 18,591 | 4,519,129 |
| 21 years | 31 | 2,852 | 18,356 | 4,354,294 |
| 22 to 24 years | 150 | 9,570 | 47,599 | 12,712,576 |
| 25 to 29 years | 146 | 14,571 | 73,121 | 21,101,849 |
| 30 to 34 years | 168 | 14,686 | 71,351 | 19,962,099 |
| 35 to 39 years | 241 | 18,972 | 82,152 | 20,179,642 |
| 40 to 44 years | 370 | 24,114 | 97,026 | 20,890,964 |
| 45 to 49 years | 495 | 28,371 | 113,564 | 22,708,591 |
| 50 to 54 years | 491 | 27,146 | 112,397 | 22,298,125 |
| 55 to 59 years | 390 | 22,186 | 96,289 | 19,664,805 |
| 60 and 61 years | 159 | 7,932 | 34,487 | 7,113,727 |
| 62 to 64 years | 228 | 10,850 | 47,467 | 9,704,197 |
| 65 and 66 years | 115 | 5,542 | 24,674 | 5,319,902 |
| 67 to 69 years | 155 | 7,155 | 32,502 | 7,115,361 |
| 70 to 74 years | 179 | 8,519 | 39,586 | 9,278,166 |
| 75 to 79 years | 136 | 6,670 | 31,774 | 7,317,795 |
| 80 to 84 years | 78 | 4,901 | 24,971 | 5,743,327 |
| 85 years and over | 48 | 4,637 | 24,761 | 5,493,433 |
| MEDIAN AGE BY SEX | ||||
| Both sexes Map | 46.00 | 42.20 | 41.10 | 37.20 |
| Male Map | 45.30 | 41.40 | 40.20 | 35.80 |
| Female Map | 46.40 | 43.00 | 42.00 | 38.50 |
| HOUSEHOLDS | ||||
| Total Households Map | 1,978 | 115,033 | 518,973 | 116,716,292 |
| HOUSEHOLDS, HOUSEHOLD TYPE | ||||
| Family households: Map | 1,311 | 79,832 | 344,197 | 77,538,296 |
| Husband-wife family Map | 1,102 | 64,858 | 270,635 | 56,510,377 |
| Other family: Map | 209 | 14,974 | 73,562 | 21,027,919 |
| Male householder, no wife present Map | 72 | 4,779 | 23,315 | 5,777,570 |
| Female householder, no husband present Map | 137 | 10,195 | 50,247 | 15,250,349 |
| Nonfamily households: Map | 667 | 35,201 | 174,776 | 39,177,996 |
| Householder living alone Map | 575 | 26,976 | 133,057 | 31,204,909 |
| Householder not living alone Map | 92 | 8,225 | 41,719 | 7,973,087 |
| HOUSEHOLDS, HISPANIC OR LATINO ORIGIN OF HOUSEHOLDER | ||||
| Not Hispanic or Latino householder: Map | 1,962 | 113,416 | 509,439 | 103,254,926 |
| Hispanic or Latino householder: Map | 16 | 1,617 | 9,534 | 13,461,366 |
| HOUSEHOLDS, RACE OF HOUSEHOLDER | ||||
| Householder who is White alone | 1,941 | 111,267 | 496,219 | 89,754,352 |
| Householder who is Black or African American alone | 3 | 700 | 4,683 | 14,129,983 |
| Householder who is American Indian and Alaska Native alone | 2 | 178 | 1,181 | 939,707 |
| Householder who is Asian alone | 15 | 1,433 | 8,340 | 4,632,164 |
| Householder who is Native Hawaiian and Other Pacific Islander alone | 0 | 31 | 119 | 143,932 |
| Householder who is Some Other Race alone | 2 | 490 | 3,316 | 4,916,427 |
| Householder who is Two or More Races | 15 | 934 | 5,115 | 2,199,727 |
| HOUSEHOLDS, HOUSEHOLD TYPE BY HOUSEHOLD SIZE | ||||
| Family households: Map | 1,311 | 79,832 | 344,197 | 77,538,296 |
| 2-person household Map | 606 | 33,538 | 153,972 | 31,882,616 |
| 3-person household Map | 268 | 18,914 | 80,618 | 17,765,829 |
| 4-person household Map | 280 | 17,550 | 69,137 | 15,214,075 |
| 5-person household Map | 108 | 6,791 | 26,963 | 7,411,997 |
| 6-person household Map | 27 | 2,113 | 9,151 | 3,026,278 |
| 7-or-more-person household Map | 22 | 926 | 4,356 | 2,237,501 |
| Nonfamily households: Map | 667 | 35,201 | 174,776 | 39,177,996 |
| 1-person household Map | 575 | 26,976 | 133,057 | 31,204,909 |
| 2-person household Map | 85 | 7,068 | 34,951 | 6,360,012 |
| 3-person household Map | 4 | 834 | 4,428 | 992,156 |
| 4-person household Map | 2 | 248 | 1,698 | 411,171 |
| 5-person household Map | 1 | 47 | 402 | 126,634 |
| 6-person household Map | 0 | 15 | 135 | 48,421 |
| 7-or-more-person household Map | 0 | 13 | 105 | 34,693 |
| HOUSING UNITS | ||||
| Total Housing Units Map | 2,112 | 126,709 | 614,754 | 131,704,730 |
| HOUSING UNITS, OCCUPANCY STATUS | ||||
| Occupied Map | 1,978 | 115,033 | 518,973 | 116,716,292 |
| Vacant Map | 134 | 11,676 | 95,781 | 14,988,438 |
| HOUSING UNITS, OCCUPIED, TENURE | ||||
| Owned with a mortgage or a loan Map | 1,114 | 67,445 | 266,988 | 52,979,430 |
| Owned free and clear Map | 394 | 20,920 | 101,328 | 23,006,644 |
| Renter occupied Map | 470 | 26,668 | 150,657 | 40,730,218 |
| HOUSING UNITS, VACANT, VACANCY STATUS | ||||
| For rent Map | 19 | 2,207 | 13,293 | 4,137,567 |
| Rented, not occupied Map | 1 | 154 | 787 | 206,825 |
| For sale only Map | 30 | 1,480 | 7,521 | 1,896,796 |
| Sold, not occupied Map | 3 | 298 | 1,393 | 421,032 |
| For seasonal, recreational, or occasional use Map | 69 | 6,112 | 63,910 | 4,649,298 |
| For migrant workers Map | 0 | 3 | 27 | 24,161 |
| Other vacant Map | 12 | 1,422 | 8,850 | 3,652,759 |
| HOUSING UNITS, OCCUPIED, AVERAGE HOUSEHOLD SIZE BY TENURE | ||||
| Total: Map | 2.42 | 2.54 | 2.46 | 2.58 |
| Owner occupied Map | 2.67 | 2.70 | 2.59 | 2.65 |
| Renter occupied Map | 1.59 | 2.04 | 2.14 | 2.44 |
| HOUSING UNITS, OCCUPIED, TENURE BY RACE OF HOUSEHOLDER | ||||
| Owner occupied: Map | 1,508 | 88,365 | 368,316 | 75,986,074 |
| Householder who is White alone Map | 1,483 | 86,196 | 357,747 | 63,446,275 |
| Householder who is Black or African American alone Map | 2 | 394 | 1,768 | 6,261,464 |
| Householder who is American Indian and Alaska Native alone Map | 1 | 106 | 618 | 509,588 |
| Householder who is Asian alone Map | 11 | 916 | 4,588 | 2,688,861 |
| Householder who is Native Hawaiian and Other Pacific Islander alone Map | 0 | 23 | 62 | 61,911 |
| Householder who is Some Other Race alone Map | 0 | 191 | 981 | 1,975,817 |
| Householder who is Two or More Races Map | 11 | 539 | 2,552 | 1,042,158 |
| Renter occupied: Map | 470 | 26,668 | 150,657 | 40,730,218 |
| Householder who is White alone Map | 458 | 25,071 | 138,472 | 26,308,077 |
| Householder who is Black or African American alone Map | 1 | 306 | 2,915 | 7,868,519 |
| Householder who is American Indian and Alaska Native alone Map | 1 | 72 | 563 | 430,119 |
| Householder who is Asian alone Map | 4 | 517 | 3,752 | 1,943,303 |
| Householder who is Native Hawaiian and Other Pacific Islander alone Map | 0 | 8 | 57 | 82,021 |
| Householder who is Some Other Race alone Map | 2 | 299 | 2,335 | 2,940,610 |
| Householder who is Two or More Races Map | 4 | 395 | 2,563 | 1,157,569 |
| HOUSING UNITS, OCCUPIED, TENURE BY HISPANIC OR LATINO ORIGIN OF HOUSEHOLDER | ||||
| Owner occupied: Map | 1,508 | 88,365 | 368,316 | 75,986,074 |
| Not Hispanic or Latino householder Map | 1,497 | 87,489 | 364,533 | 69,617,625 |
| Hispanic or Latino householder Map | 11 | 876 | 3,783 | 6,368,449 |
| Renter occupied: Map | 470 | 26,668 | 150,657 | 40,730,218 |
| Not Hispanic or Latino householder Map | 465 | 25,927 | 144,906 | 33,637,301 |
| Hispanic or Latino householder Map | 5 | 741 | 5,751 | 7,092,917 |
| HOUSING UNITS, OCCUPIED, TENURE BY HOUSEHOLD SIZE | ||||
| Owner occupied: Map | 1,508 | 88,365 | 368,316 | 75,986,074 |
| 1-person household Map | 284 | 15,675 | 71,169 | 16,453,569 |
| 2-person household Map | 568 | 32,474 | 145,151 | 27,618,605 |
| 3-person household Map | 246 | 15,964 | 63,257 | 12,517,563 |
| 4-person household Map | 259 | 15,519 | 56,745 | 10,998,793 |
| 5-person household Map | 104 | 6,054 | 21,544 | 5,057,765 |
| 6-person household Map | 26 | 1,861 | 7,138 | 1,965,796 |
| 7-or-more-person household Map | 21 | 818 | 3,312 | 1,373,983 |
| Renter occupied: Map | 470 | 26,668 | 150,657 | 40,730,218 |
| 1-person household Map | 291 | 11,301 | 61,888 | 14,751,340 |
| 2-person household Map | 123 | 8,132 | 43,772 | 10,624,023 |
| 3-person household Map | 26 | 3,784 | 21,789 | 6,240,422 |
| 4-person household Map | 23 | 2,279 | 14,090 | 4,626,453 |
| 5-person household Map | 5 | 784 | 5,821 | 2,480,866 |
| 6-person household Map | 1 | 267 | 2,148 | 1,108,903 |
| 7-or-more-person household Map | 1 | 121 | 1,149 | 898,211 |
Loading...